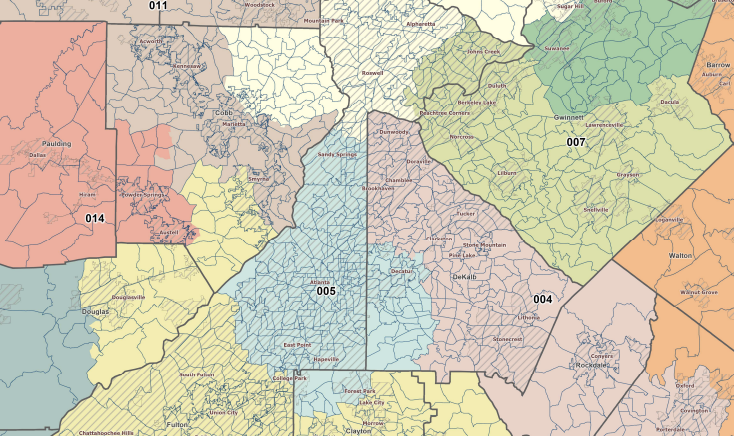
On Monday, Nov. 22, the Georgia House of Representatives completed the final task of the redistricting process, sending the congressional district map to Governor Brian Kemp for his signature.
- Georgia is growing and changing: According to U.S. Census data, Georgia’s population, now topping 10,700,000, has grown by over one million in the past decade. This increase has ballooned population centers in some areas, while several rural communities saw populations decline. These realities factored heavily into the redrawn districts. USDA’s Economic Research Service found that Georgia is not alone in this population shift as 23 other States also lost population in rural areas over the last decade.
- Why this is important: The process has resulted in a number of changes. Important to Georgia Forestry Association (GFA) members, the process represents a shift in elected leaders to metropolitan areas and a loss of rural leaders in the Georgia House and Senate.
- What they are saying: “This process is very important to our members,” GFA President & CEO Andres Villegas said. “We will depend more heavily on the ForestPAC and FORT (Forest Resource Teams) to expand our engagement strategy to educate new and increasingly urban group of state leaders positioned to take office in the coming years.”
Now that the maps are finalized (although court challenges are likely), let’s take a deeper dive into the known realities, as well as potential impacts, of these newly drawn districts.

Georgia House District Map
There are currently 103 Republicans and 77 Democrats in the House. Under the newly drawn maps, the Republicans that tend to represent rural areas will likely lose seats and suburban areas that are largely Democratic stand to gain six seats after the 2022 elections.
The House map introduces several newly formed districts in metro Atlanta – seats where there are no incumbents. In addition, there are two new districts in Cobb County, two in Gwinnett County, one in Fulton County and one in Rockdale County. Each House district in the state will represent about 59,500 residents.
- Election Insight: The mapmaking process has drawn some representatives into districts that favor their opponents, and others are forced to face members of their own party. Some of these pairings stand to have an immediate impact to committees that are very important to our forestry interests. These include committees on Appropriations, Natural Resources and Environment, Agriculture, and Transportation, among others.
- One particular battle of interest pits Republican Rep. Gerald Greene’s 38 years of service in a district based in Cuthbert and Democratic Rep. Winfred Dukes’ 24 years of service based in the Albany area.
- Republican Reps. James Burchett of Waycross and Dominic LaRiccia of Douglas were paired together, as were Reps. Danny Mathis of Cochran and Robert Pruitt of Eastman. In addition, Democratic Reps. Shelly Hutchinson and Rebecca Mitchell would be paired in Gwinnett County.
Georgia Senate District Map
Republicans currently hold a 34-22 lead in the Senate and under the new districts political consultants expect the Senate to shift slightly to 33-23 majority. While this doesn’t sound like much change, there will indeed be a large shift in the makeup of the Senate Chamber. Each Senate district in the state will represent about 191,300 residents.
- Election Insight: Of the 56 Senators, at least eight have stated their intent to retire or run for higher office. This shift will see the loss of leadership in key committees including Agriculture, Finance, Appropriations, and Natural Resources, among others.
- These vacancies, along with the new House and Senate districts, will likely draw more House Members toward seeking higher office in the Senate or statewide.
Georgia Congressional District Map
The 2018 election began to show the impact of state population and demographic changes to Georgia’s 14 congressional districts. Population growth in the north metro region was a large contributor to how the map was laid out. Each Congressional district will represent about 765,000 residents.
- Election Insight: The once 10-4 Republican majority was trimmed to 8-6 following the 2020 election. With the new maps redrawn to reflect the statewide population changes, nine of the 14 would favor Republican candidates and 13 of the 14 would likely protect current Democratic incumbents.
GFA is Positioned to Win
There is much to glean from the new maps, but ultimately it is the voters that will decide the victors, not the maps. Those seeking new opportunities to serve, strive for re-election, or take aim at higher office, will make that first step when candidate qualifying begins in March 2022.
- What to expect: GFA members can expect several things in 2023 from these newly drawn maps. First, is a dramatic shift in the percentage of elected leaders northward and into metropolitan areas. Second, is a loss of rural leaders in the Georgia House and Senate.
- Our strategy: We will depend more heavily on the ForestPAC and FORT (Forest Resource Teams) to expand our engagement strategy to educate new and increasingly urban group of state leaders positioned to take office in the coming years.
Georgia’s forest industry has made great strides in building relationships with elected officials. These engagements are driven by a desire to be inclusive in a changing and growing Georgia. Continued population growth will further alter the percentages of urban representation, and with elections every two years, another decade of change will bring even more shifts to elected leadership. Indeed, change is the only constant in life, and GFA is ready.

